This post is part of a series of analysis based on Bengs predictive modelling leveraging WHO data. Full modelling constraints are detailed here.
This updates represents estimates as of 05th April 2020, and the news from the front are not very good for everyone.
It’s going up and up
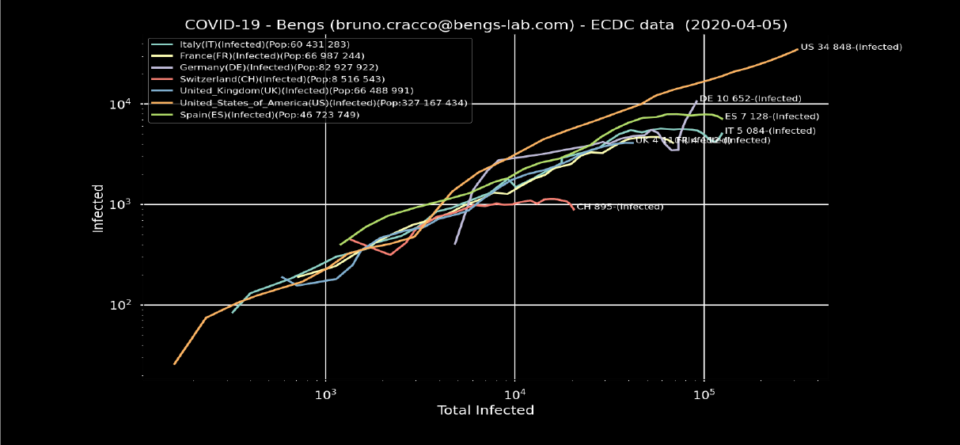
A quick look at our exponential curves so as not to lose our bearings, and you can see that it’s rising everywhere, with a very impressive slope for the United States, which has exceeded 300,000 cases.
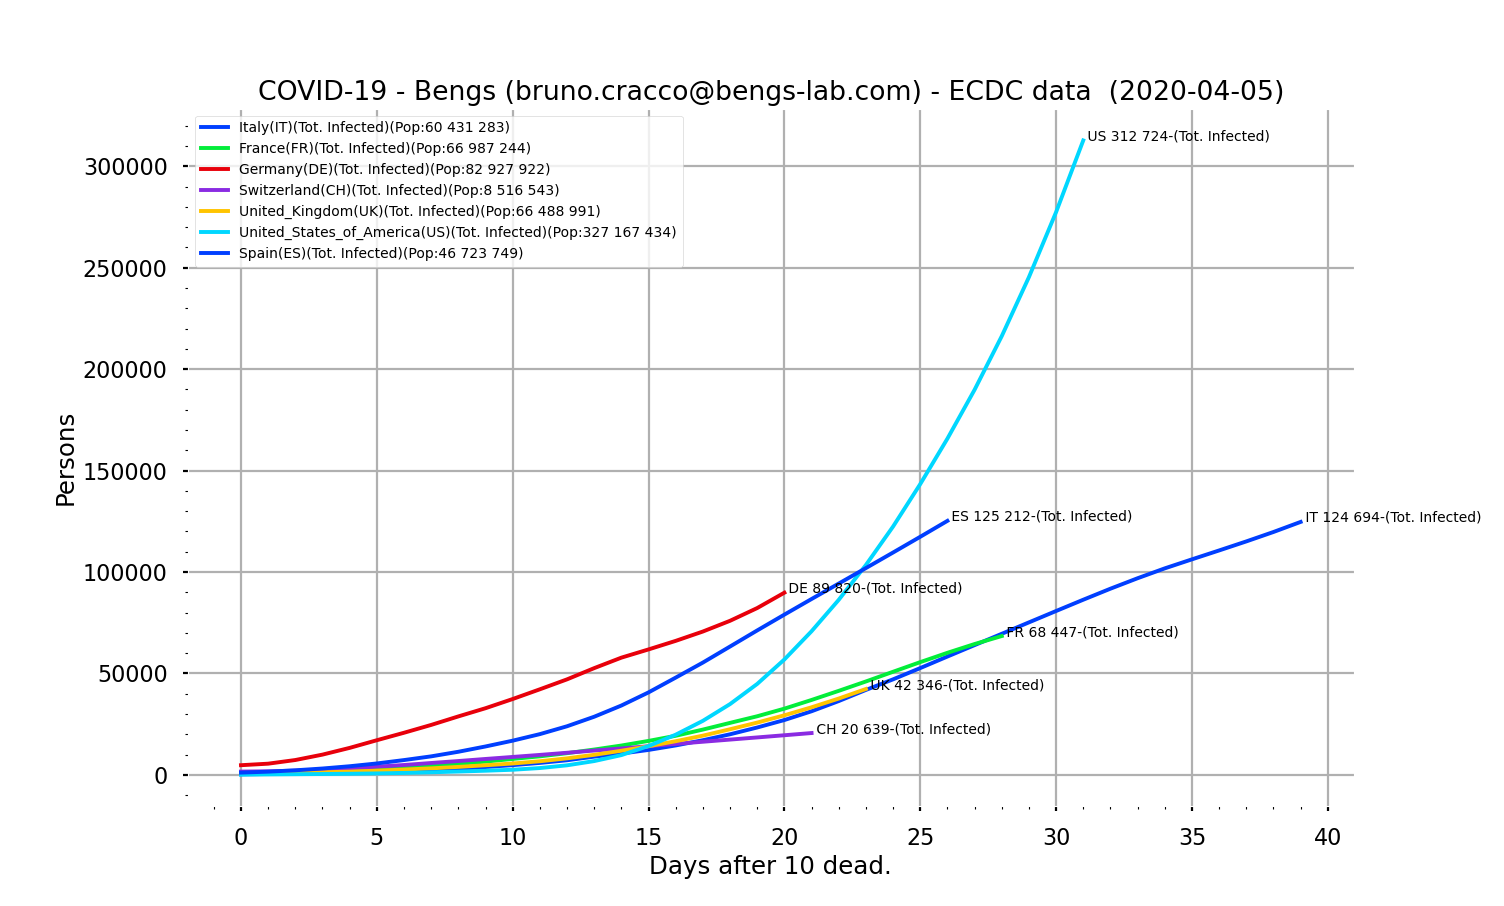
Fig. 1: Double logarithmic scale plot of Italy, France, Germany, Switzerland, UK, USA and Spain
But this kind of trace does not allow us to appreciate the situation. Instead, double logarithmic scale plots must be used.
Italy and Spain confirm that they are on the right track, France is taking a break, Germany is to be watched and the USA is still on a dizzying trajectory
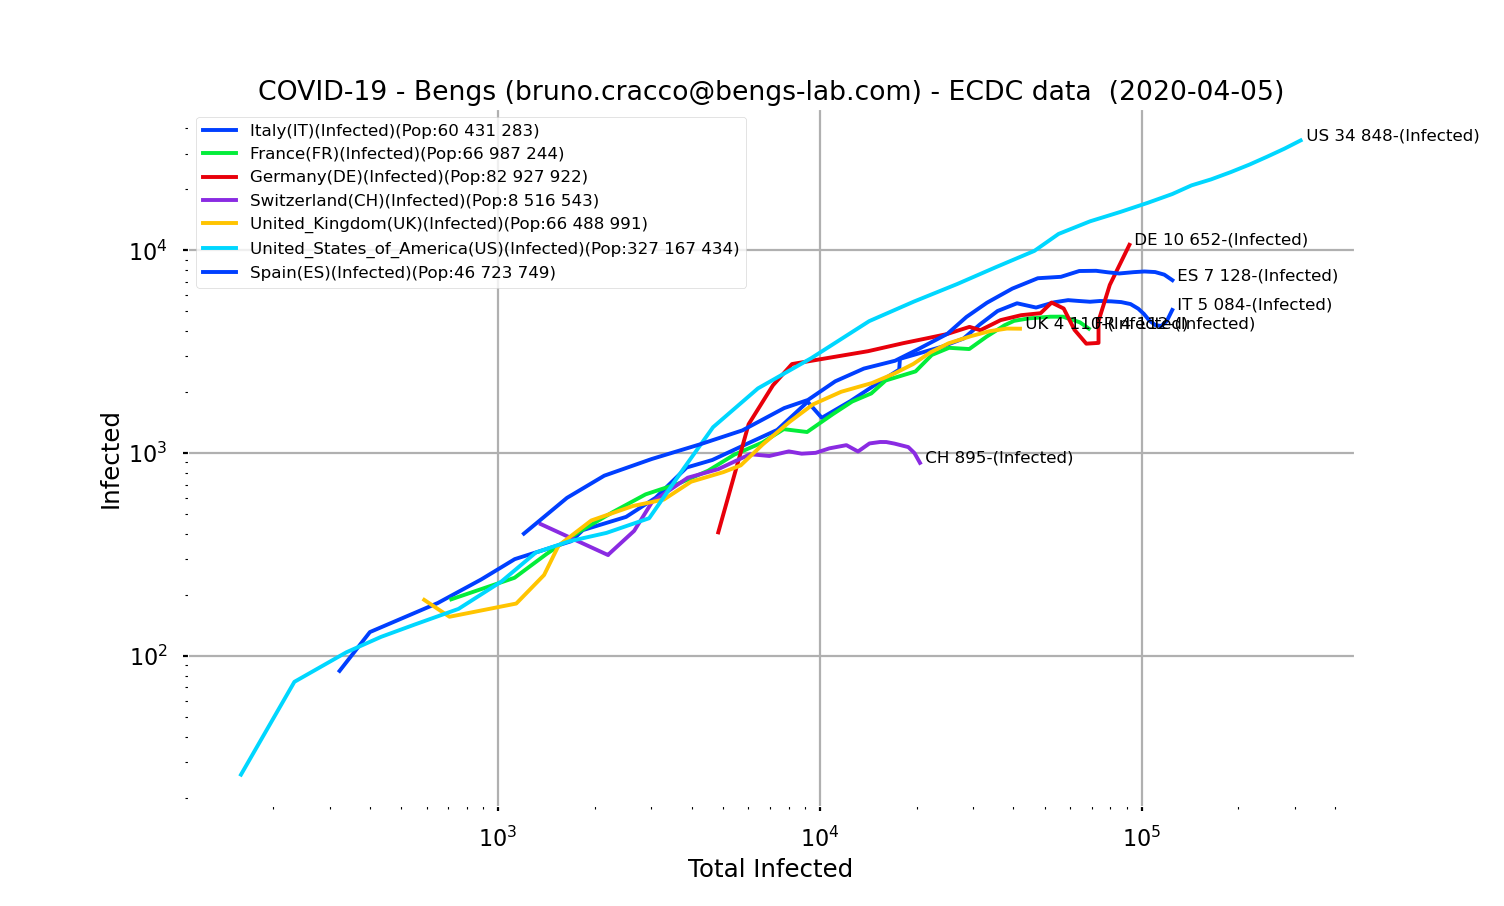
Fig. 2: Double logarithmic scale graph of Italy, France, Germany, Switzerland, UK, USA and Spain
As we noticed in midweek, Italy confirmed that the situation had improved (even Sunday’s small comeback did not bring the curve back on the crossbar). Spain, France and Switzerland are showing the beginnings of controlling the epidemic, which is being confirmed day by day.
For Germany, on the other hand, there has been a fairly strong comeback that has brought them back to the initial trajectory. We will see in the coming days whether this trend is confirmed.
Unfortunately, for the United States, the very bad trend is being confirmed, with no sign of improvement. For nearly a week now, no inflection has been apparent.
What about the dangerousness of Covid-sars-2 ?
On the death front, the situation is also mixed. The number of deaths reflects on the one hand the intrinsic mortality of Covid-19 disease, but also the quality and capacity of the local health system.
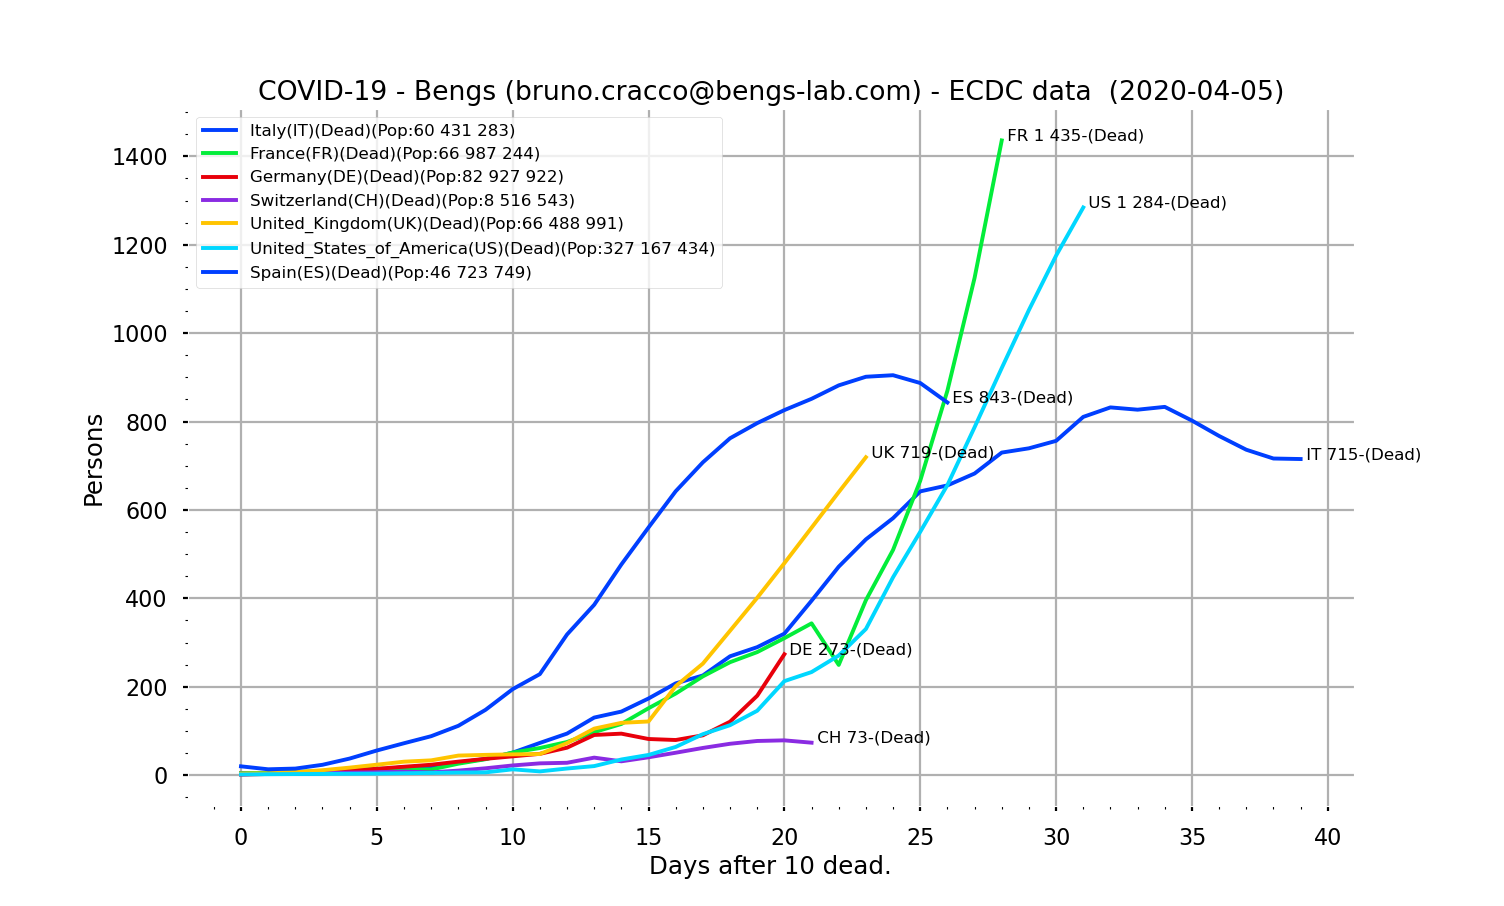
Fig. 3: Graph of daily deaths for Italy, France, Germany, Switzerland, UK, USA and Spain as a function of the number of days since the 10th death. Savitzky-Golay filtering
There is a clear decrease in Italy and Spain. On the other hand, in France, England and the USA, it is a dizzying growth. The particularly high growth rate for France is the result of the integration of deaths in EPHAD since Saturday, and therefore a change in the counting method. This weighs on the calculated trend.
The analysis of the day: how counting policy influences the measurement of disease “mortality”
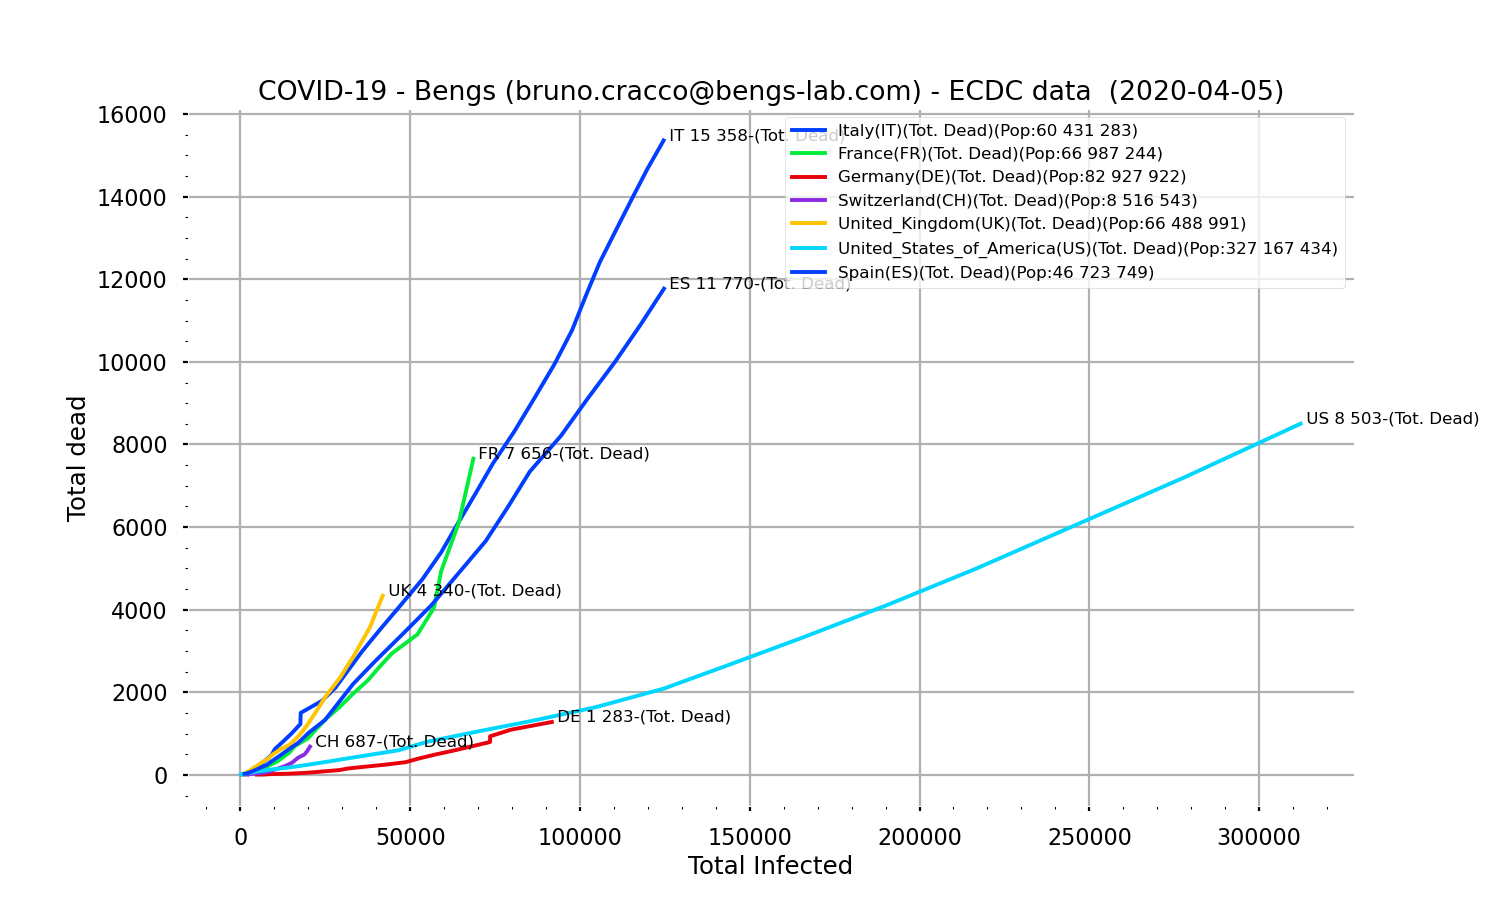
Fig. 4: Graph of the total number of deaths as a function of the total number of cases testing positive for Covid-SARS-2 for Italy, France, Germany, Switzerland, USA, UK and Spain.
One can also observe the evolution of mortality as a function of the number of days since the 10th recorded death.
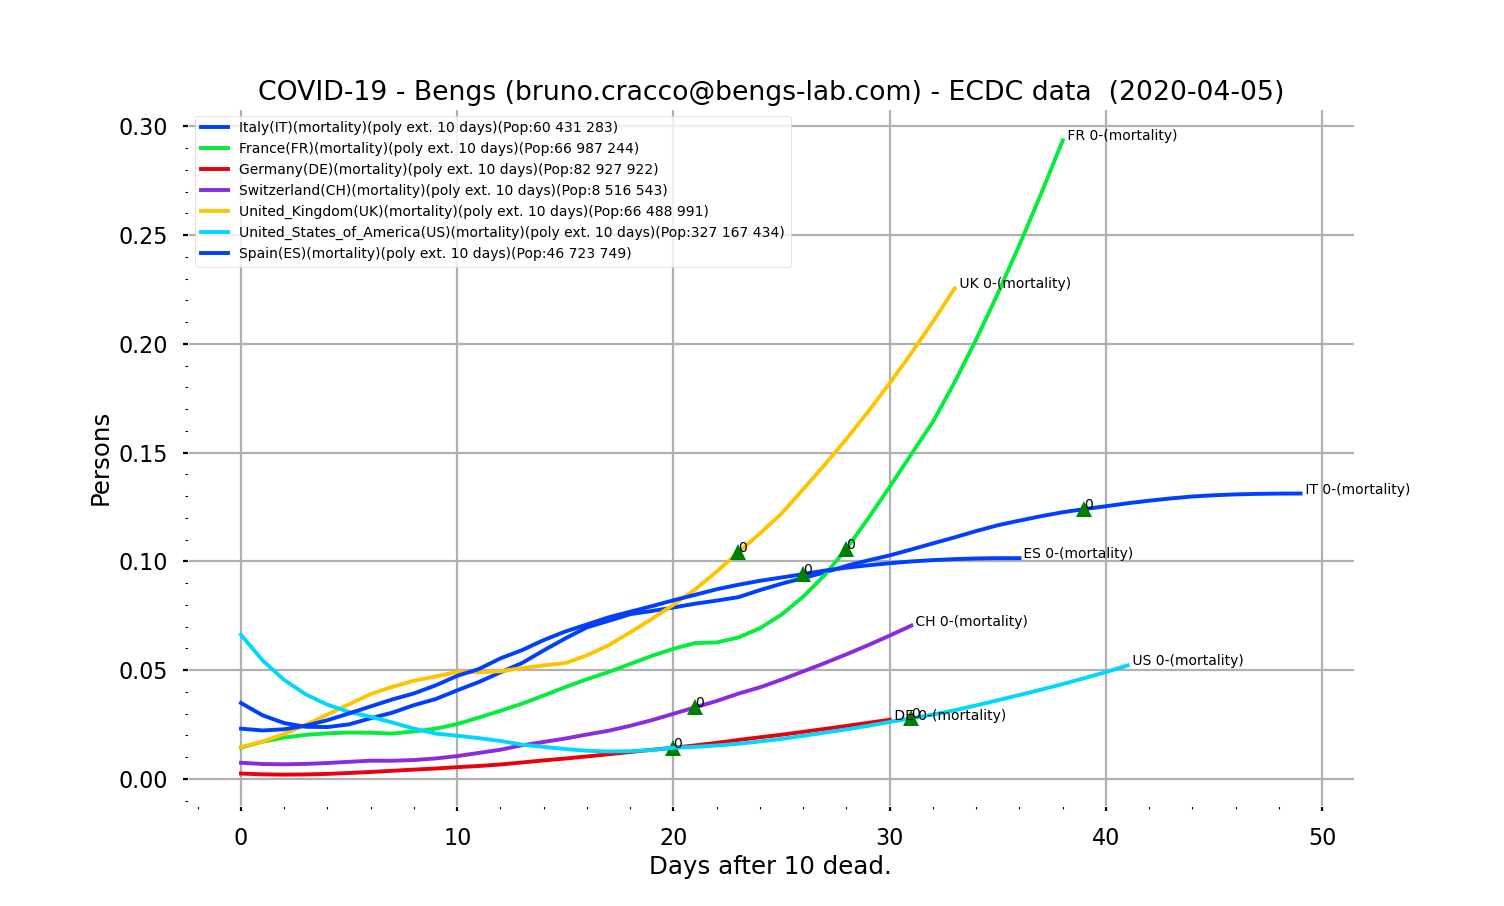
Fig. 5: Mortality trend (total number of deaths divided by the total number of positive cases) as a function of the number of days since the 10th death for Italy, France, Germany, Switzerland, USA, UK and Spain
We’re back to our two cohorts. Since the disease has the same effects on all humans, it cannot be explained that it kills between 1.5% and 3.3% of affected Germans, Americans and Swiss, while it kills more than 10% in the other countries in our sample.
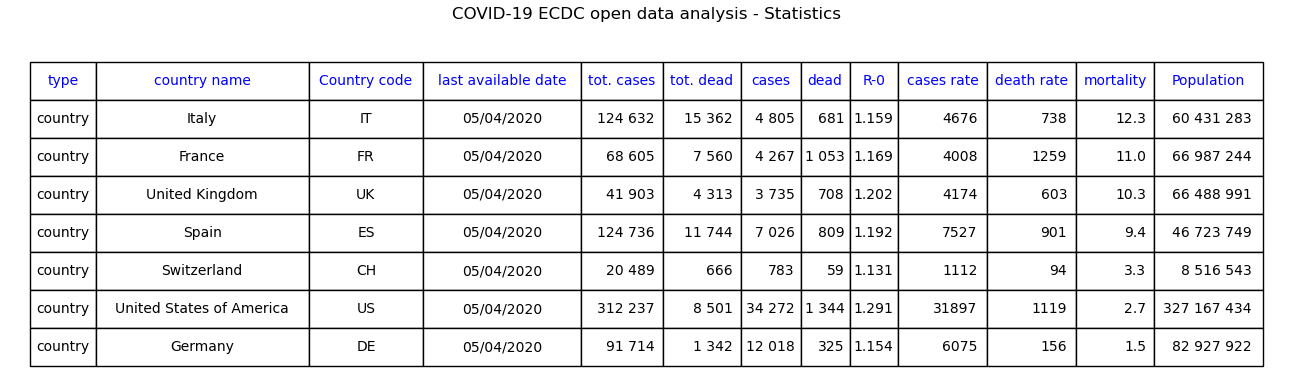
Fig. 6: Table of the countries in our sample ranked in descending order of their mortality rates.
Since it is a ratio, the values of the numerator and denominator are key. Of course, the mortality calculated in this way depends very much on the numbers of positive cases. A country that conducts systematic testing (such as Germany) sees the number of positive cases increase, which mechanically lowers mortality.
But it is not only the denominator that depends on the country’s policy. Not all countries count deaths in the same way. In France, Italy and Spain, post-mortem tests are carried out and any deceased who tests positive is considered a victim of Covid-19, even if a pre-existing medical condition existed. In contrast, in Germany, there is no postmortem test for the presence of covid-sars-2. So if the person was sick with something else, even if they had covid-sars-2, they are not counted as a victim.
But what we are seeing is that mortality is increasing, without stabilizing for all these countries, without exception. This means that there has not yet been enough time for this rate to stabilise, whatever the counting policy chosen. Indeed, people with severe variant disease do not die immediately. They are placed in intensive care units in an attempt to save them, and this can take several weeks, because the care provided in these specialized units can keep extremely serious cases alive for weeks at a time.
Despite the controversy over its (death) figures, china gives a reference
One country that has had enough of a setback is China. So what’s the mortality rate in China?
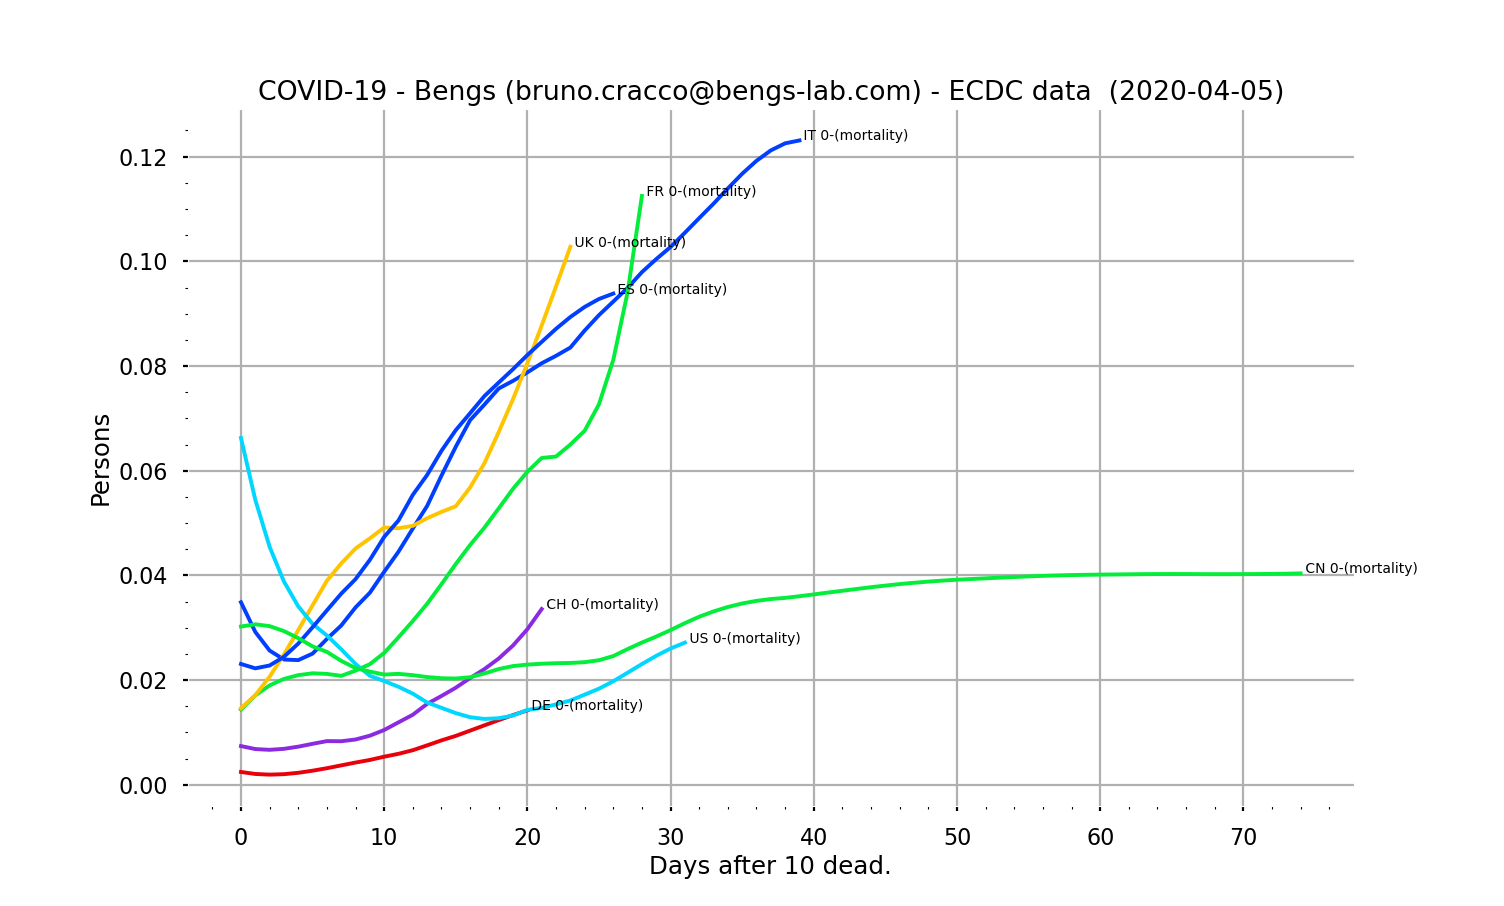
Fig. 7: Mortality trend (total number of deaths divided by the total number of positive cases) as a function of the number of days since the 10th death for Italy, France, Germany, Switzerland, USA, UK, Spain and China.
Three things are clearly visible on this graph:
- a curve that evolves between 2 and 4%,
- a very clear asymptote at 4%
- and finally a stabilization time of almost 50 days after the tenth death.
We note, and we will have to watch this in the coming days, that Italy and Spain seem to be beginning to move towards an asymptote much higher than 4%. This is not the case in the UK and France, which seem to be moving towards much higher values.
Germany and the United States are following a curve that seems surprisingly similar, and close to that of China. Do the Chinese count in the same way as the Germans and the Americans? If so, the mortality rate in the US will be 4%. Hence the challenge of controlling contamination because with more than 300,000 cases recorded, it is already 14,000 deaths. At 500,000 cases, that’s 20,000 deaths. However, the epidemic seems far from being under control in the USA. And if we go up to several million cases…
Can we see where the mortality rate of Covid-19 will become established in Italy and Spain?
In order to try to establish the mortality rates that the different countries will end up with, a polynomial extrapolation of the mortality curve can be attempted. This purely mathematical calculation does not reflect the daily efforts made by the medical profession to save lives, but after the implementation of measures to stabilize contamination in Italy and Spain, it may be thought that a stabilized regime is beginning to be established which in fact follows a mathematical law (like any epidemic).
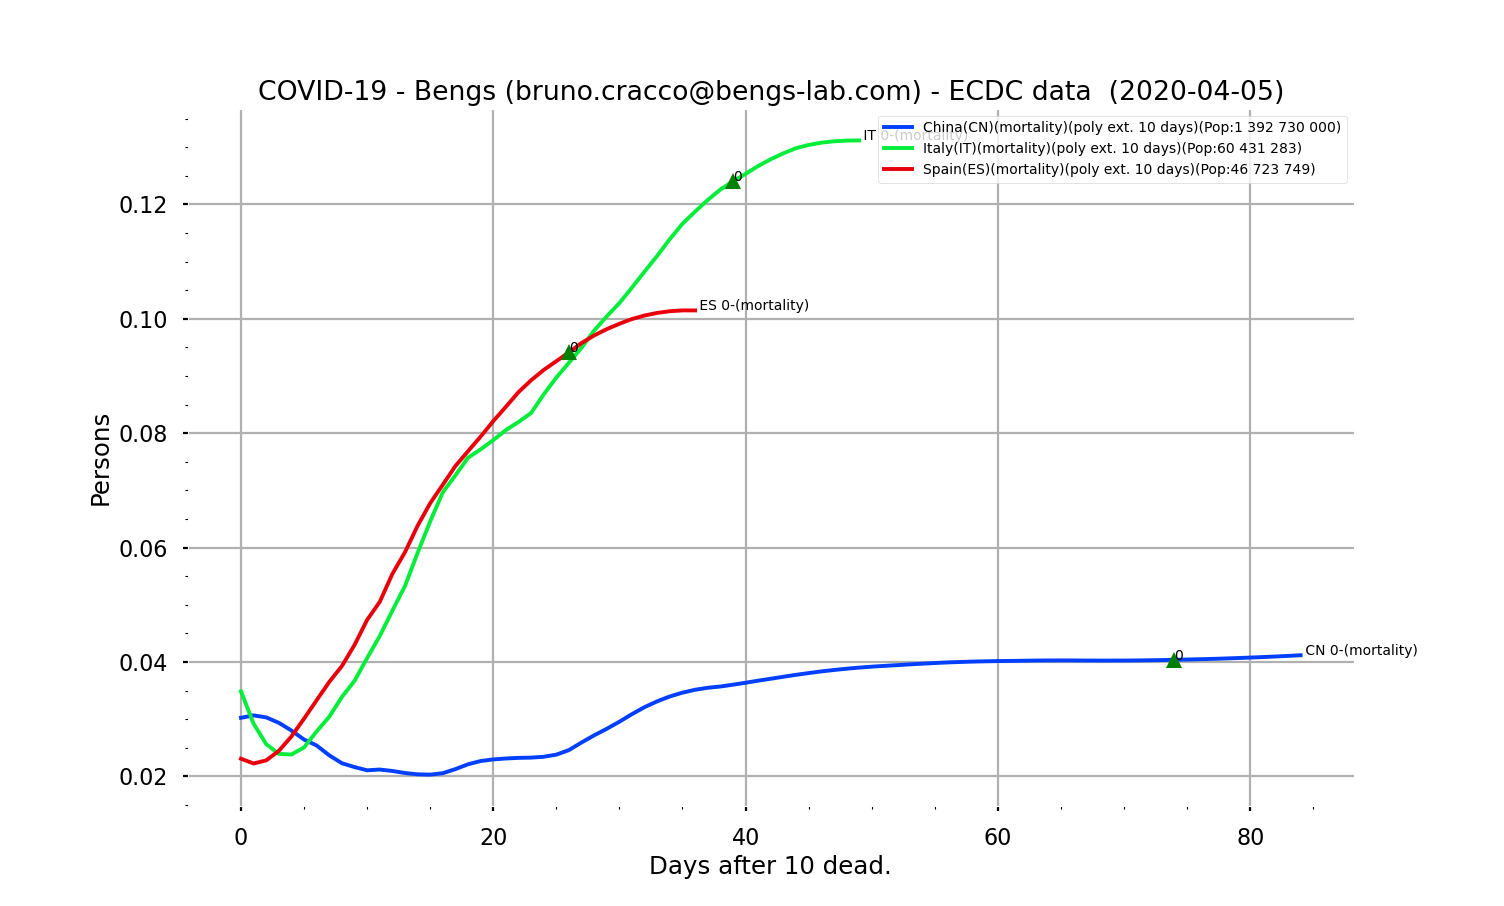
Fig. 8: Mortality evolution curves for Italy and Spain (with reference to China) as a function of the number of days after the 10th death, 10-day polynomial extrapolation.
The rates in Spain and Italy seem likely to be 10% and 13% respectively. It should not be forgotten that they are highly dependent on the way in which cases of contamination and deaths are counted. It is in fact complicated, if not unnecessary, to compare them with each other. Nevertheless, they do allow a potential assessment of the number of victims to be made by projecting the total number of cases of contamination, which also follows a very mathematical law.
We will be monitoring all of this in the coming days and weeks to see how the situation evolves and whether these forecasts are accurate.
Countries to watch in the coming weeks
Here is a Top 15 of the countries with the highest daily rate of new contaminations (linear extrapolation over the last 3 days).
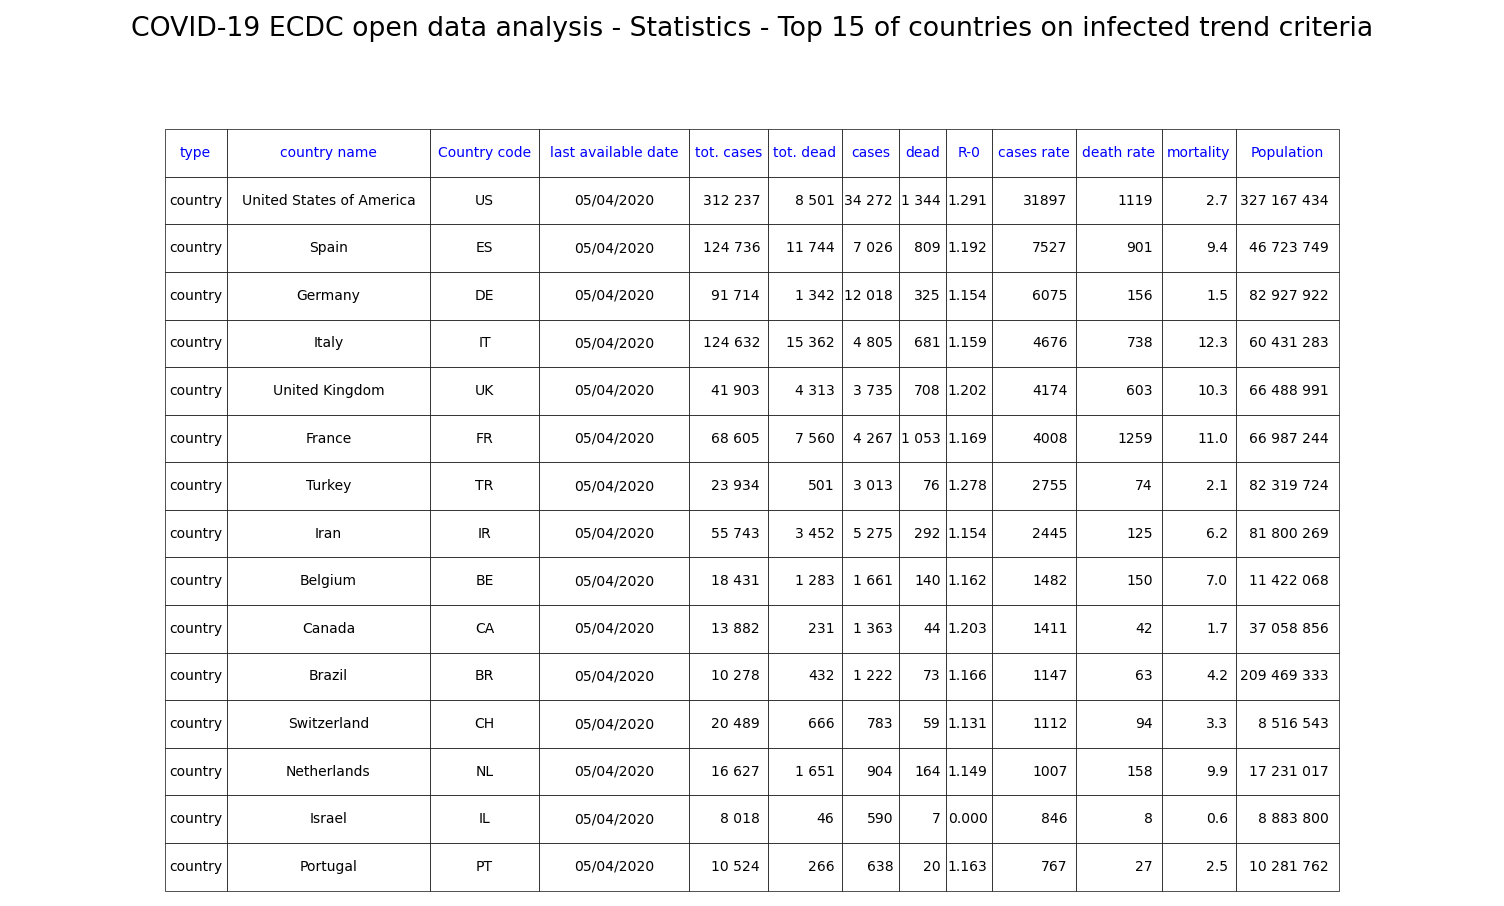
Fig. 9: Top 15 countries with the highest growth rates in the number of new infections (as of 05/05/2020)
We’ll have to keep an eye on countries like Turkey and the Netherlands, which are in the top 15.